Top 10 Regions by Deal Volume: Poltava Takes the Lead for the First Time
L LandData Explorer August 23, 2026
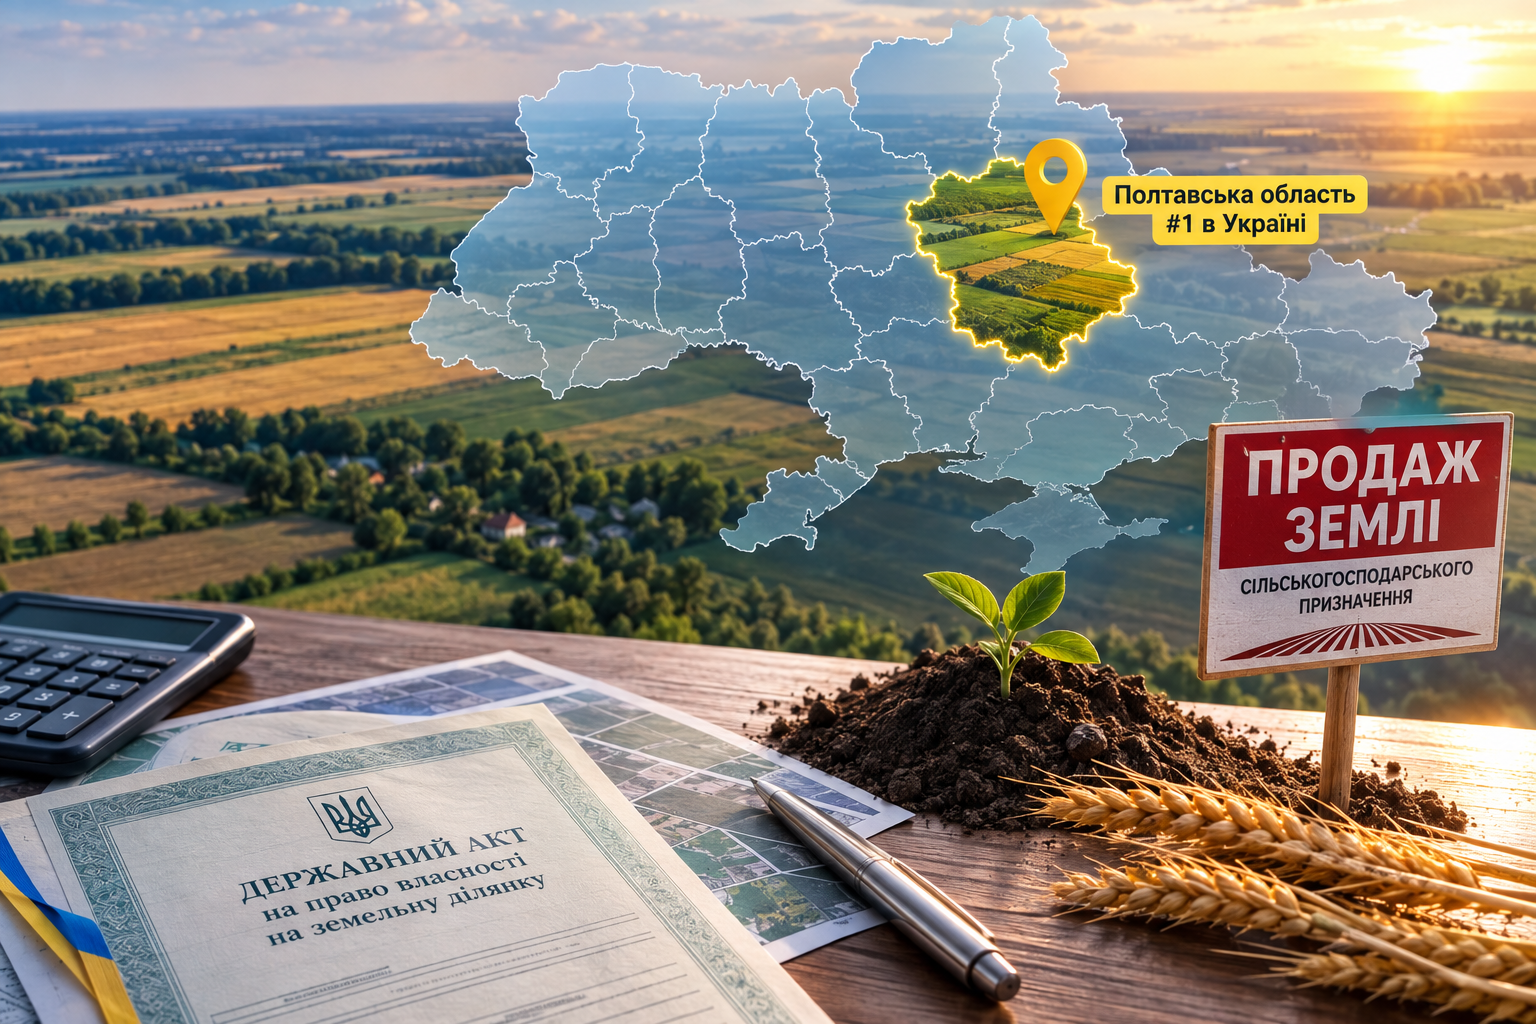
By the cumulative number of registered agricultural land purchase-sale deals since records began, Poltava region has taken the lead with 39,196 deals. It overtook Khmelnytskyi (36,494) and Vinnytsia (36,194) — until recently the two main contenders for first place. We look at why Poltava came out on top and what it means for the rest of the regions.
Top 10 Regions by Number of Deals
Here is the full ranking of regions by cumulative registered land purchase-sale deals — from the start of tracking through today:
- Poltava39,196
- Khmelnytskyi36,494
- Vinnytsia36,194
- Sumy34,486
- Kyiv33,353
- Chernihiv27,609
- Zhytomyr24,880
- Kharkiv24,019
- Volyn22,948
- Dnipropetrovsk22,858
Data covers all registered agricultural land purchase-sale deals from July 1, 2021 through July 2026 inclusive.
Poltava’s lead is no accident. It’s the region with the largest sold area in the dataset — a total of 112,044 hectares sold all-time, more than anywhere else in Ukraine. The vast majority of deals (92.4%) involve arable land, and 60.3% of buyers register the land for commercial agricultural production — that is, for large agribusinesses rather than personal farming. In other words, Poltava is one of the largest and most active arable land markets in the country, and it’s that scale, not a handful of big individual deals, that keeps it in first place.
Still, the gap is razor-thin. Poltava leads Khmelnytskyi by just 2,702 deals (+7.4%) and Vinnytsia by 3,002 (+8.3%). For a market that counts tens of thousands of deals in each of these regions, that’s a statistically thin margin: roughly 10,000 new deals are registered across Ukraine every month, with hundreds in each of the three leading regions. So the leader and its closest followers could easily swap places within a few months.
Leading by Volume Doesn’t Always Mean Leading by Price
Deal count and price per hectare are two different rankings, and they don’t always line up:
| Region | All-time deals | Price per ha (all-time) |
|---|---|---|
| Poltava | 39,196 | UAH 54.7K |
| Khmelnytskyi | 36,494 | UAH 51.3K |
| Vinnytsia | 36,194 | UAH 53.4K |
| Sumy | 34,486 | UAH 37.5K |
| Kyiv | 33,353 | UAH 54.1K |
| Chernihiv | 27,609 | UAH 39.4K |
| Zhytomyr | 24,880 | UAH 43.1K |
| Kharkiv | 24,019 | UAH 38.6K |
| Volyn | 22,948 | UAH 44.1K |
| Dnipropetrovsk | 22,858 | UAH 36.2K |
All-time average price across Ukraine — UAH 43.7K/ha.
Tellingly, leading by deal count and leading by price are separate rankings. Ivano-Frankivsk, the most expensive region all-time (UAH 66.7K/ha), doesn’t make the volume top 10 — far fewer deals are registered there. The reverse is also true: in Sumy (UAH 37.5K/ha), Chernihiv (UAH 39.4K/ha), Kharkiv (UAH 38.6K/ha), and Dnipropetrovsk (UAH 36.2K/ha) — all high-volume regions — the price per hectare sits below the national average (UAH 43.7K/ha). The volume leaders aren’t necessarily the most expensive regions, but rather the ones where the land market has historically been the most liquid and active.
The Combat Factor
Kharkiv region deserves a separate note — it ranks 8th on this list (24,019 all-time deals), but the lion’s share of those deals were registered before the full-scale war. In July 2026 the number of new deals there fell to 327 — down 43.7% from the month before, one of the steepest drops of any region. Active combat is ongoing directly in Kharkiv region, and this is a structural, not temporary, factor: until the security situation changes, its share of the national market will most likely keep shrinking, and its position in this ranking will keep weakening. A similar, if less pronounced, picture holds for Sumy (4th place) and Chernihiv (6th place): combat is happening in parts of their territory too, not just near the border, so both hold onto their top-10 spots mainly on the strength of activity accumulated over past years rather than their current pace.
For owners and buyers of land in Poltava, Khmelnytskyi, or Vinnytsia regions, leading by deal count mainly signals a deep, liquid market: a large base of completed deals means more reference points for comparing prices and, typically, a faster search for a buyer or seller than in regions where deals are rare. But leading by deal count shouldn’t be confused with leading by price — the decision on what to sell or buy a plot for should be based on the price in that specific region, not its place in this ranking.
At the same time, the ranking itself stays fluid. The gap between the top three regions is just a few thousand deals, while roughly 10,000 new transactions are registered across Ukraine every month. So the next time we revisit this ranking, a different region could well be in first place — especially given that some traditionally active regions bordering the combat zone keep losing ground to the war, while central and western regions keep growing their market share.